Looking for the best stocks to invest in today? Our DCF valuation reveals Travelers (TRV) may be deeply undervalued with over 385% upside potential in the bull case. With strong free cash flow, a stable dividend, and growth visibility, TRV stands out as one of the best growth stocks for the next 5 years. This data driven analysis is ideal for investors focused on long term stocks, shares, and stocks with solid fundamentals.
I. DCF Valuation — Bear Case
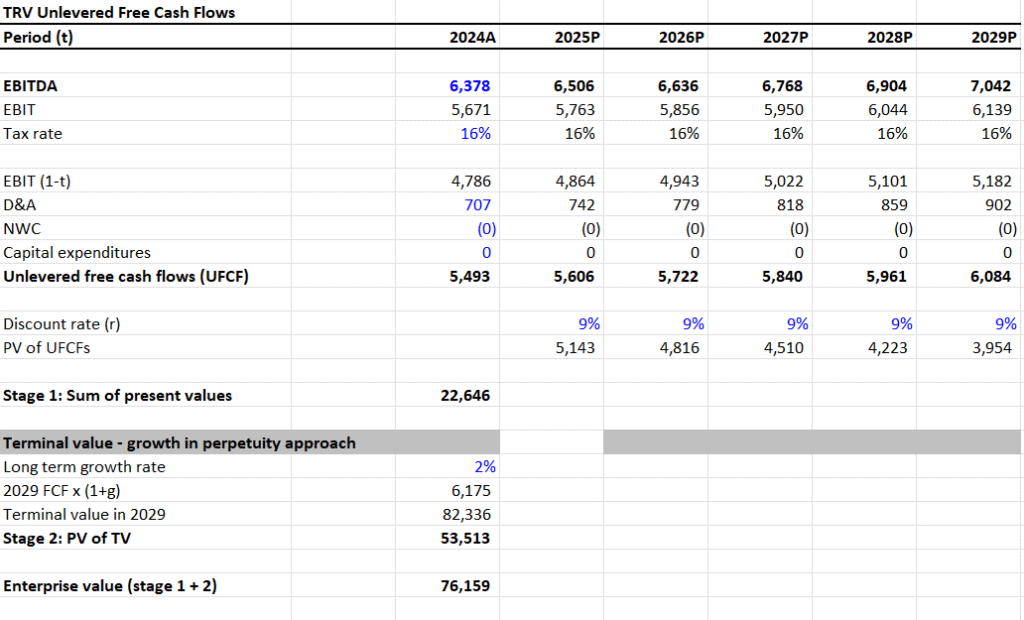
Assumptions:
- EBITDA Growth Rate: 2%
- Terminal Growth Rate: 1.5%
- Discount Rate: 9%
Valuation Outputs:
- Sum of PV of UFCF (2024–2029): $22,646
- Terminal Value: $82,336
- PV of Terminal Value: $53,513
- Enterprise Value (EV): $76,159
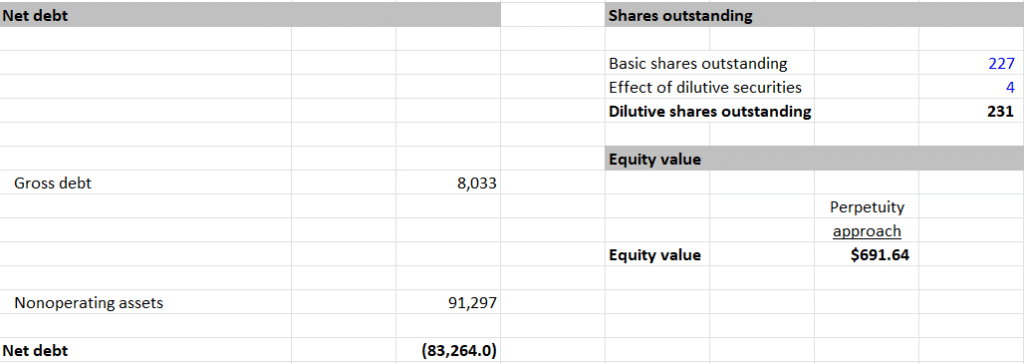
- Net Debt: -$83,264
- Equity Value: $159,423
- Shares Outstanding: 227M
- Intrinsic Value per Share: $691.64
II. DCF Valuation — Base Case
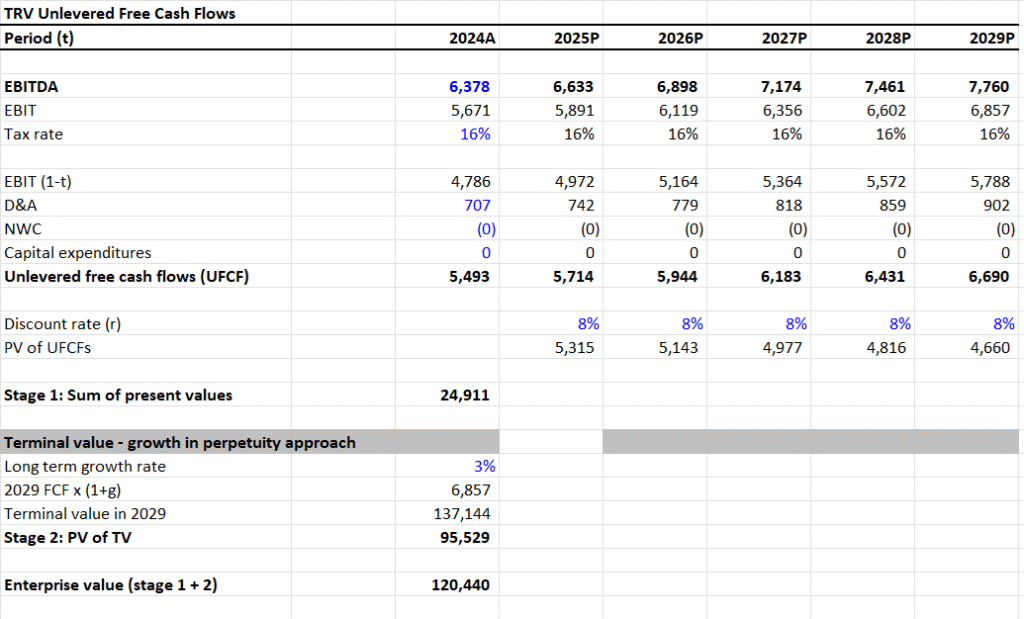
Assumptions:
- EBITDA Growth Rate: 4%
- Terminal Growth Rate: 2.5%
- Discount Rate: 7.5%
Valuation Outputs:
- Sum of PV of UFCF (2024–2029): $24,911
- Terminal Value: $137,144
- PV of Terminal Value: $95,529
- Enterprise Value (EV): $120,440
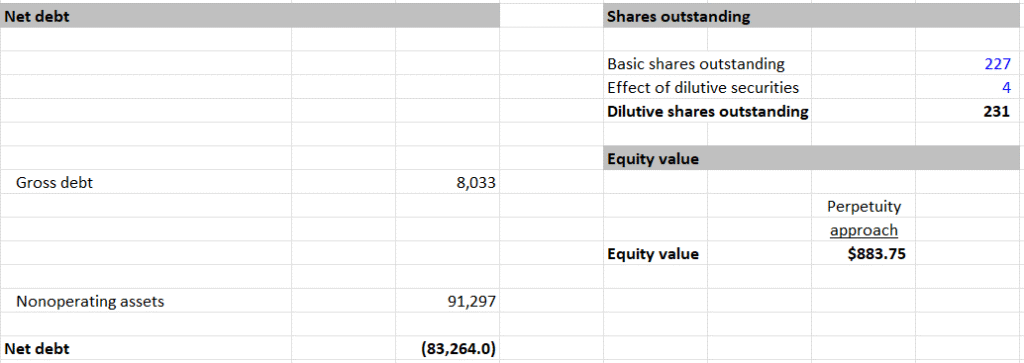
- Net Debt: -$83,264
- Equity Value: $203,704
- Shares Outstanding: 227M
- Intrinsic Value per Share: $883.75
III. DCF Valuation — Bull Case
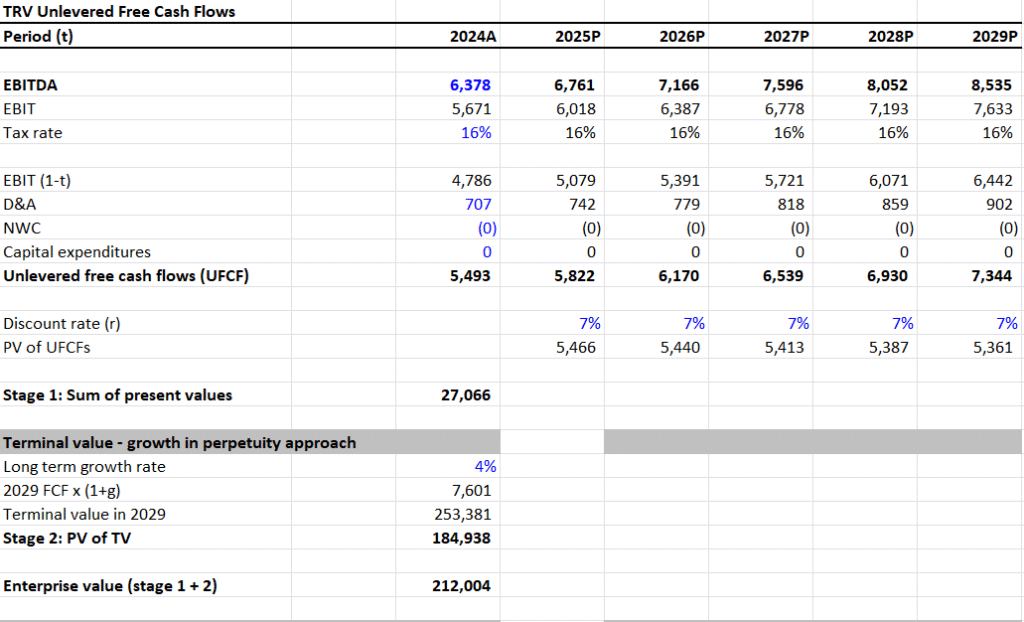
Assumptions:
- EBITDA Growth Rate: 6%
- Terminal Growth Rate: 3.5%
- Discount Rate: 6.5%
Valuation Outputs:
- Sum of PV of UFCF (2024–2029): $27,066
- Terminal Value: $253,381
- PV of Terminal Value: $184,938
- Enterprise Value (EV): $212,004
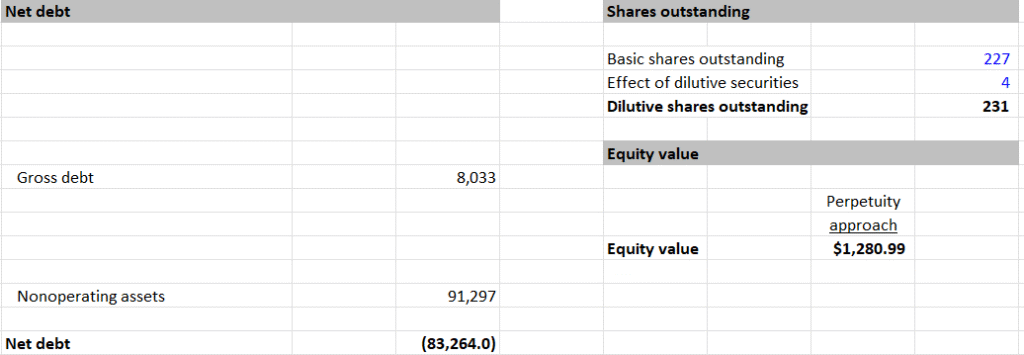
- Net Debt: -$83,264
- Equity Value: $295,268
- Shares Outstanding: 227M
- Intrinsic Value per Share: $1,280.99
IV. Valuation Summary and Upside Potential
- Current Price: $264
- Bear Case Intrinsic Value: $691.64 → 162% Upside
- Base Case Intrinsic Value: $883.75 → 234% Upside
- Bull Case Intrinsic Value: $1,280.99 → 385% Upside
V. Dividend Sustainability Analysis
- Dividend per Share: $4.20
- Shares Outstanding: 227M
- Total Dividends Paid: 227 × 4.20 = $953M
- Free Cash Flow (Used for Analysis): $8,976M
Dividend Payout Ratio (FCF Basis):
- $953 / $8,976 = 0.106 or ~10.6%
Assessment:
- Very low payout ratio
- TRV retains ~89% of FCF for reinvestment, debt reduction, or buybacks
- Dividend appears extremely sustainable
VI. Summary View
This report adheres to a quantitative-only, assumption-transparent methodology. With strong free cash flow and a conservative payout policy, TRV appears significantly undervalued in all modeled cases.
- Valuation Range: $691.64 – $1,280.99
- Dividend Risk: Minimal, with ample coverage and reinvestment room
- Quantitative Takeaway: Current price of $264 is far below modeled intrinsic value
D.R. Horton (DHI): An Undervalued Stock With Strong Upside Across Scenarios (2025)


